Introduction
ServiceNow offers a platform and solutions for your business to enhance productivity through optimisation of workflow. In this article, we will be speaking to their ITSM Tool, which we utilise as part of our support service to our customers. Any "incident" or "service request" gets raised as a ticket on ServiceNow's system, flagged with a priority level based on impact and automatically routes it to the appropriate teams/stakeholders. This is definitely a poweful tool that boosts collaboration between teams and provides the necessary visibility to help manage customer expectations.

SLA Dashboard
ServiceNow does offer a dashboard that allows us to measure our ability to resolve tickets that have been raised in the business. Unfortunately, we are unable to filter between our customers which is what has prompted us to develop this solution, and now we're sharing it with you!
In this tutorial, we'll be working with APIs provided by ServiceNow and using C# to store it as JSON in Azure Cloud Blob Storage. Afterwards, we'll show you how to draw the data from the blob storage with Power BI.
Jump to:
- Requirements
- 1. Testing your REST API from ServiceNow (optional)
- 2. Write API output to Azure Blob Storage with C#
- 3. Connect to Power BI
- 4. Using Power BI's Dataflows
Requirements
I'm hoping that this guide will be easy to consume for those that only have a basic understanding of coding and have some experience in writing code. However, you will need to know what an API is and what it is used for - See Restful.io - An introduction to APIs for a great explanation.
TLDR; a way for two devices connected with the internet to transfer data between each other.
You will need to install the following apps for this tutorial:
- Microsoft Visual Studio
- Microsoft Azure Cloud Account (we use Azure Blob Storage, but you can save this locally)
- Power BI
- Postman or PowerShell (for testing)
1. Testing your REST API from ServiceNow
We separate our tickets into two buckets: Incidents and Service Requests. They're both from different tables and with ServiceNow's Table API, we'll have to make two GET requests:
Incidents -
https://xxxx.service-now.com/api/now/table/incident?sysparm_display_value=true&sysparm_limit=5000&sysparm_query=sys_created_onCONTAINS2019Service Requests -
https://xxxx.service-now.com/api/now/table/sc_request?sysparm_display_value=true&sysparm_limit=5000&sysparm_query=sys_created_onCONTAINS2019
For our tutorial, we have added these parameters to the query:
sysparm_display_value=true- definitely need this to display the correct value for some of the fieldssysparm_limit=5000- returns a limited number of records in a single outputsysparm_query=sys_created_onCONTAINS2019- filter on a specific field (here we are looking for all records created in 2019)- You can add additional query parameters - see here to learn more.
We also need to inject the following two headers into our GET request:
Authorization: Bearer xxxxxxxxxxxxxxxxxxxxxxxxxxxxx- grants access to our data and is acquired through your ServiceNow platformContent-Type: application/json- returns the output in JSON format (easily digestible for Power BI)
Go ahead and test these APIs out, in either PowerShell or Postman, to make sure that your request is getting data back.
For PowerShell we have the following script to send the GET request:
See below screenshot for the Postman form:

Postman Request
Your output should return a result of similiar structure to this.
2. Write API output to Azure Blob Storage with C#
You will need Microsoft Visual Studio, visit the Microsoft store if you haven't already installed it.
In Visual Studio, let's start by creating a new project (Ctrl + Shift + N) and then select Azure Functions:

New Project
Our function needs to run periodically to query the API, grab the output and write the data needed for our report to our cache in Azure Blob Storage. So we choose Azure Function v2 (.NET Core) and the Timer trigger template running everyday at 2:00 AM by using the CRON expression 0 0 2 * * * as schedule. To learn more about CRON expressions check this: cheatsheet.

Select trigger
Now that we are ready to start writing our function, keep in mind that we will breaking out our function into smaller components so that it will be easier to read and we can reuse parts for building other functions in the future.
Note that we are using the asychronous method, which means that the function will process requests simultaneously. We've also added private static HttpClient httpClient = new HttpClient(); which will enable us to add headers to our API requests. The flag RunOnStartup = true is also included in the TimerTrigger attribute; this helps testing the function locally by allowing us execute instantly after startup.
We also need some additional settings to configure our ServiceNow API requests. Putting those variables into the settings makes them easily configurable in our Azure App Settings.
To access the variables from local.settings.json, we can call Environment.GetEnvironmentVariable("variable name") in our function.
Now we can add two new methods for our function: GetRecords and SaveBlob.
The getRecords method will take the API url and the auth token to retrieve our data:
Remember the httpClient variable from earlier? We need to inject our auth token from local.settings.json into the header to authorise our access with new AuthenticationHeaderValue("Bearer", token). The totalRecords int variable is going to be used later to determine the number of loops for our function. The totalEnumerator is a variable in the reponse header which returns the count of records for our API call - we'll need this to help determine the loops for our function.
Next, the following SaveBlob method will write our results onto our Azure Blob Storage:
Since we are now calling a different API to save to our blob storage, we call httpClient.DefaultRequestHeaders.Authorization = null to remove the auth token header that is applied to the httpClient variable otherwise it will reject out request. To call an HTTP PUT request method, we use StringContent(records, Encoding.UTF8, "application/json") to capture the content and HttpRequestMessage(HttpMethod.Put, urlStorage) to direct our content to the blob directory. Finally, we have the httpClient.SendAsync(req) which pushes our content to the request uri and, as this is an async function, we will need to call the await method to ensure that this step is completed before the rest of the code carries on.
So we're back to where the function started. We need to inject the header httpClient.DefaultRequestHeaders.Add("x-ms-blob-type", "BlockBlob") for our saveBlob method, however we cannot keep this in the method otherwise it will keep adding this header during the loops and we'll end up with x-ms-blob-type BlockBlob BlockBlob BlockBlob. The recordLimit variable is set to limit each call to 500 records, letting a single API return the entire result can be too heavy of a load on your computer and cause the function to crash.
Our function obtains data from two APIs; incidents and service requests. This is denoted by our tables variable from local.settings.json and we'll point it to the right blob directory with our container variable to follow.
Here begins our first loop foreach (string table in tables), in our scenario we begin with
incidents. Recall our urlSNOW variable
from local.settings.json - note the {0} and {1}.
We can insert variables by using the method string.Format(urlSNOW, {0}, {1}). Now we can call the getRecords method we wrote earlier.
The int variable blobCount will be used as a naming convention for our JSON files. The
container is our container name in our Azure blob storage - note that you must first create the
container on Azure, otherwise no files will be written to the directory.
After defining these two variables, we can pass them onto our next string.Format function to define our
save to blob uri urlStorageNext, which in turn is used in our saveBlob method.
This second loop for (int i = recordLimit; i < totalRecords; i +=recordLimit) helps us paginate our API
output to the 500 record limit we defined earlier. It will continue looping until we reach our
totalRecords number.
After completing the second loop, the function will come back around and serve the second interation of the first loop; running service records.
3. Connect to Power BI
We finally have our data stored on Azure Blob storage and the hard parts over, all that's left to do is load the data into Power BI.
Microsoft Power BI and Microsoft Azure Cloud Platform, both being from the same company, have made this final step really simple.
Open up Power BI, select Edit Queries and follow the following steps:

Get Data
Enter your blob storage name:

Blob Storage Name
Select the correct container on the left pane, the right pane will populate with all of your files:

Select Container
You may choose to delete the other columns if they're not needed at this step.
Now right-click the Content column header and select Transform --> JSON:
Transform to JSON
The column will transform to a list of Records, expand this by selecting the icon next to the header; do this 3 times:

Expand Records

Expand to Rows

Expand Selected Rows
Your dataset will expand out to all its columns, ready for you to build your report.
Remember to check through your data for any columns that contain a list of Records:

Rows with Records
Unfortunately this cannot be expanded in the same way as before, we will need to code the query ourselves. Open up Advanced Editor and model your code as such:

Power BI - Advanced Editor
There's no formula to process all the columns at once, you will need to do each column as its own step.
Note
Do not forget to replace any errors with blanks.
In our report, we appended the Incident table and Service Request table together, but be on the lookout for columns that don't have the same title as it will not join those columns together. In our case, we noticed that the resolved date was different in the two tables.
4. Using Power BI's Dataflows
Microsoft introduced Dataflows to help organizations unify data from disparate sources and prepare it for modeling. This essentially means that we can use Microsoft's processing power to extract and transform our data - speaking from experience, it is lightning quick and alleviates the need for our local machine's resources to crunch the data and calculations.
Note
You must have a paid Power BI account to use dataflows, such as a Power BI Pro or Power BI Premium account, but you are not charged separately for using dataflows.
This process is incredibly easy if you've already completed Step 3. In this part of the tutorial, we will assume that you have indeed been through all the previous steps.
Let's begin by logging into our Power BI portal. In the left hand pane, select the Workspace icon and select a workspace - create one if you haven't already. You should see the see the screen below:

Workspace Page
Select Get Started in the right-most content box, Dataflows. You should reach another screen where you can select Add (New) Entities. Once you've selected that, you will reach a page to choose your data source, select Blank Query.
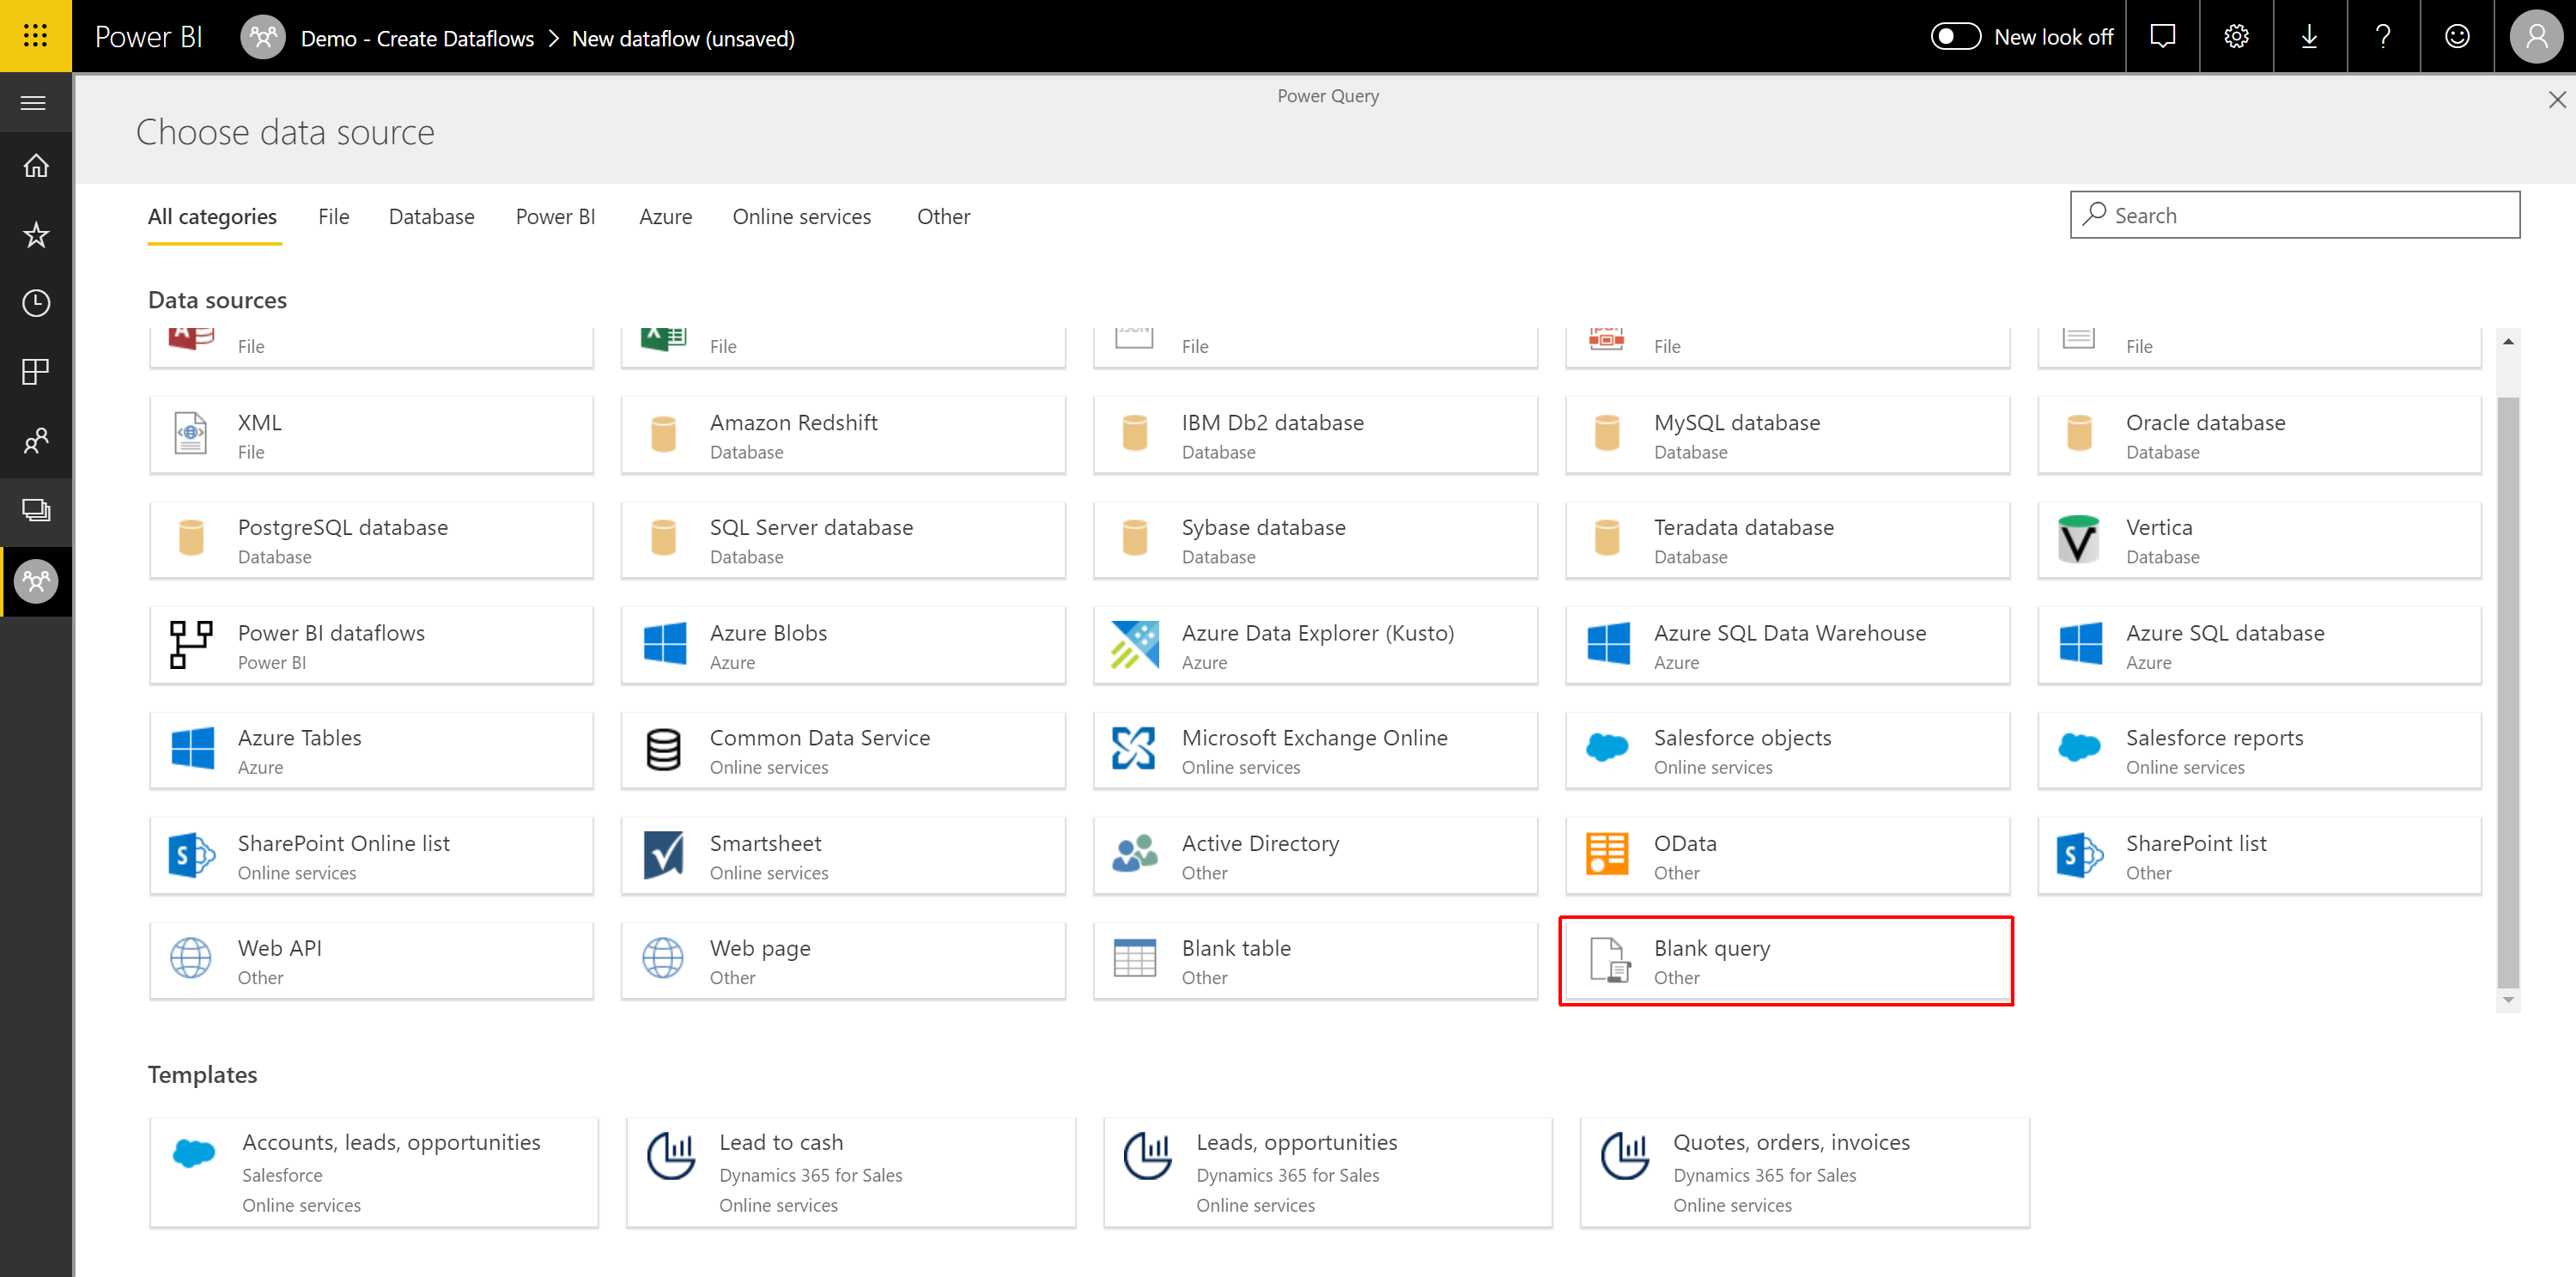
Choose Data Source
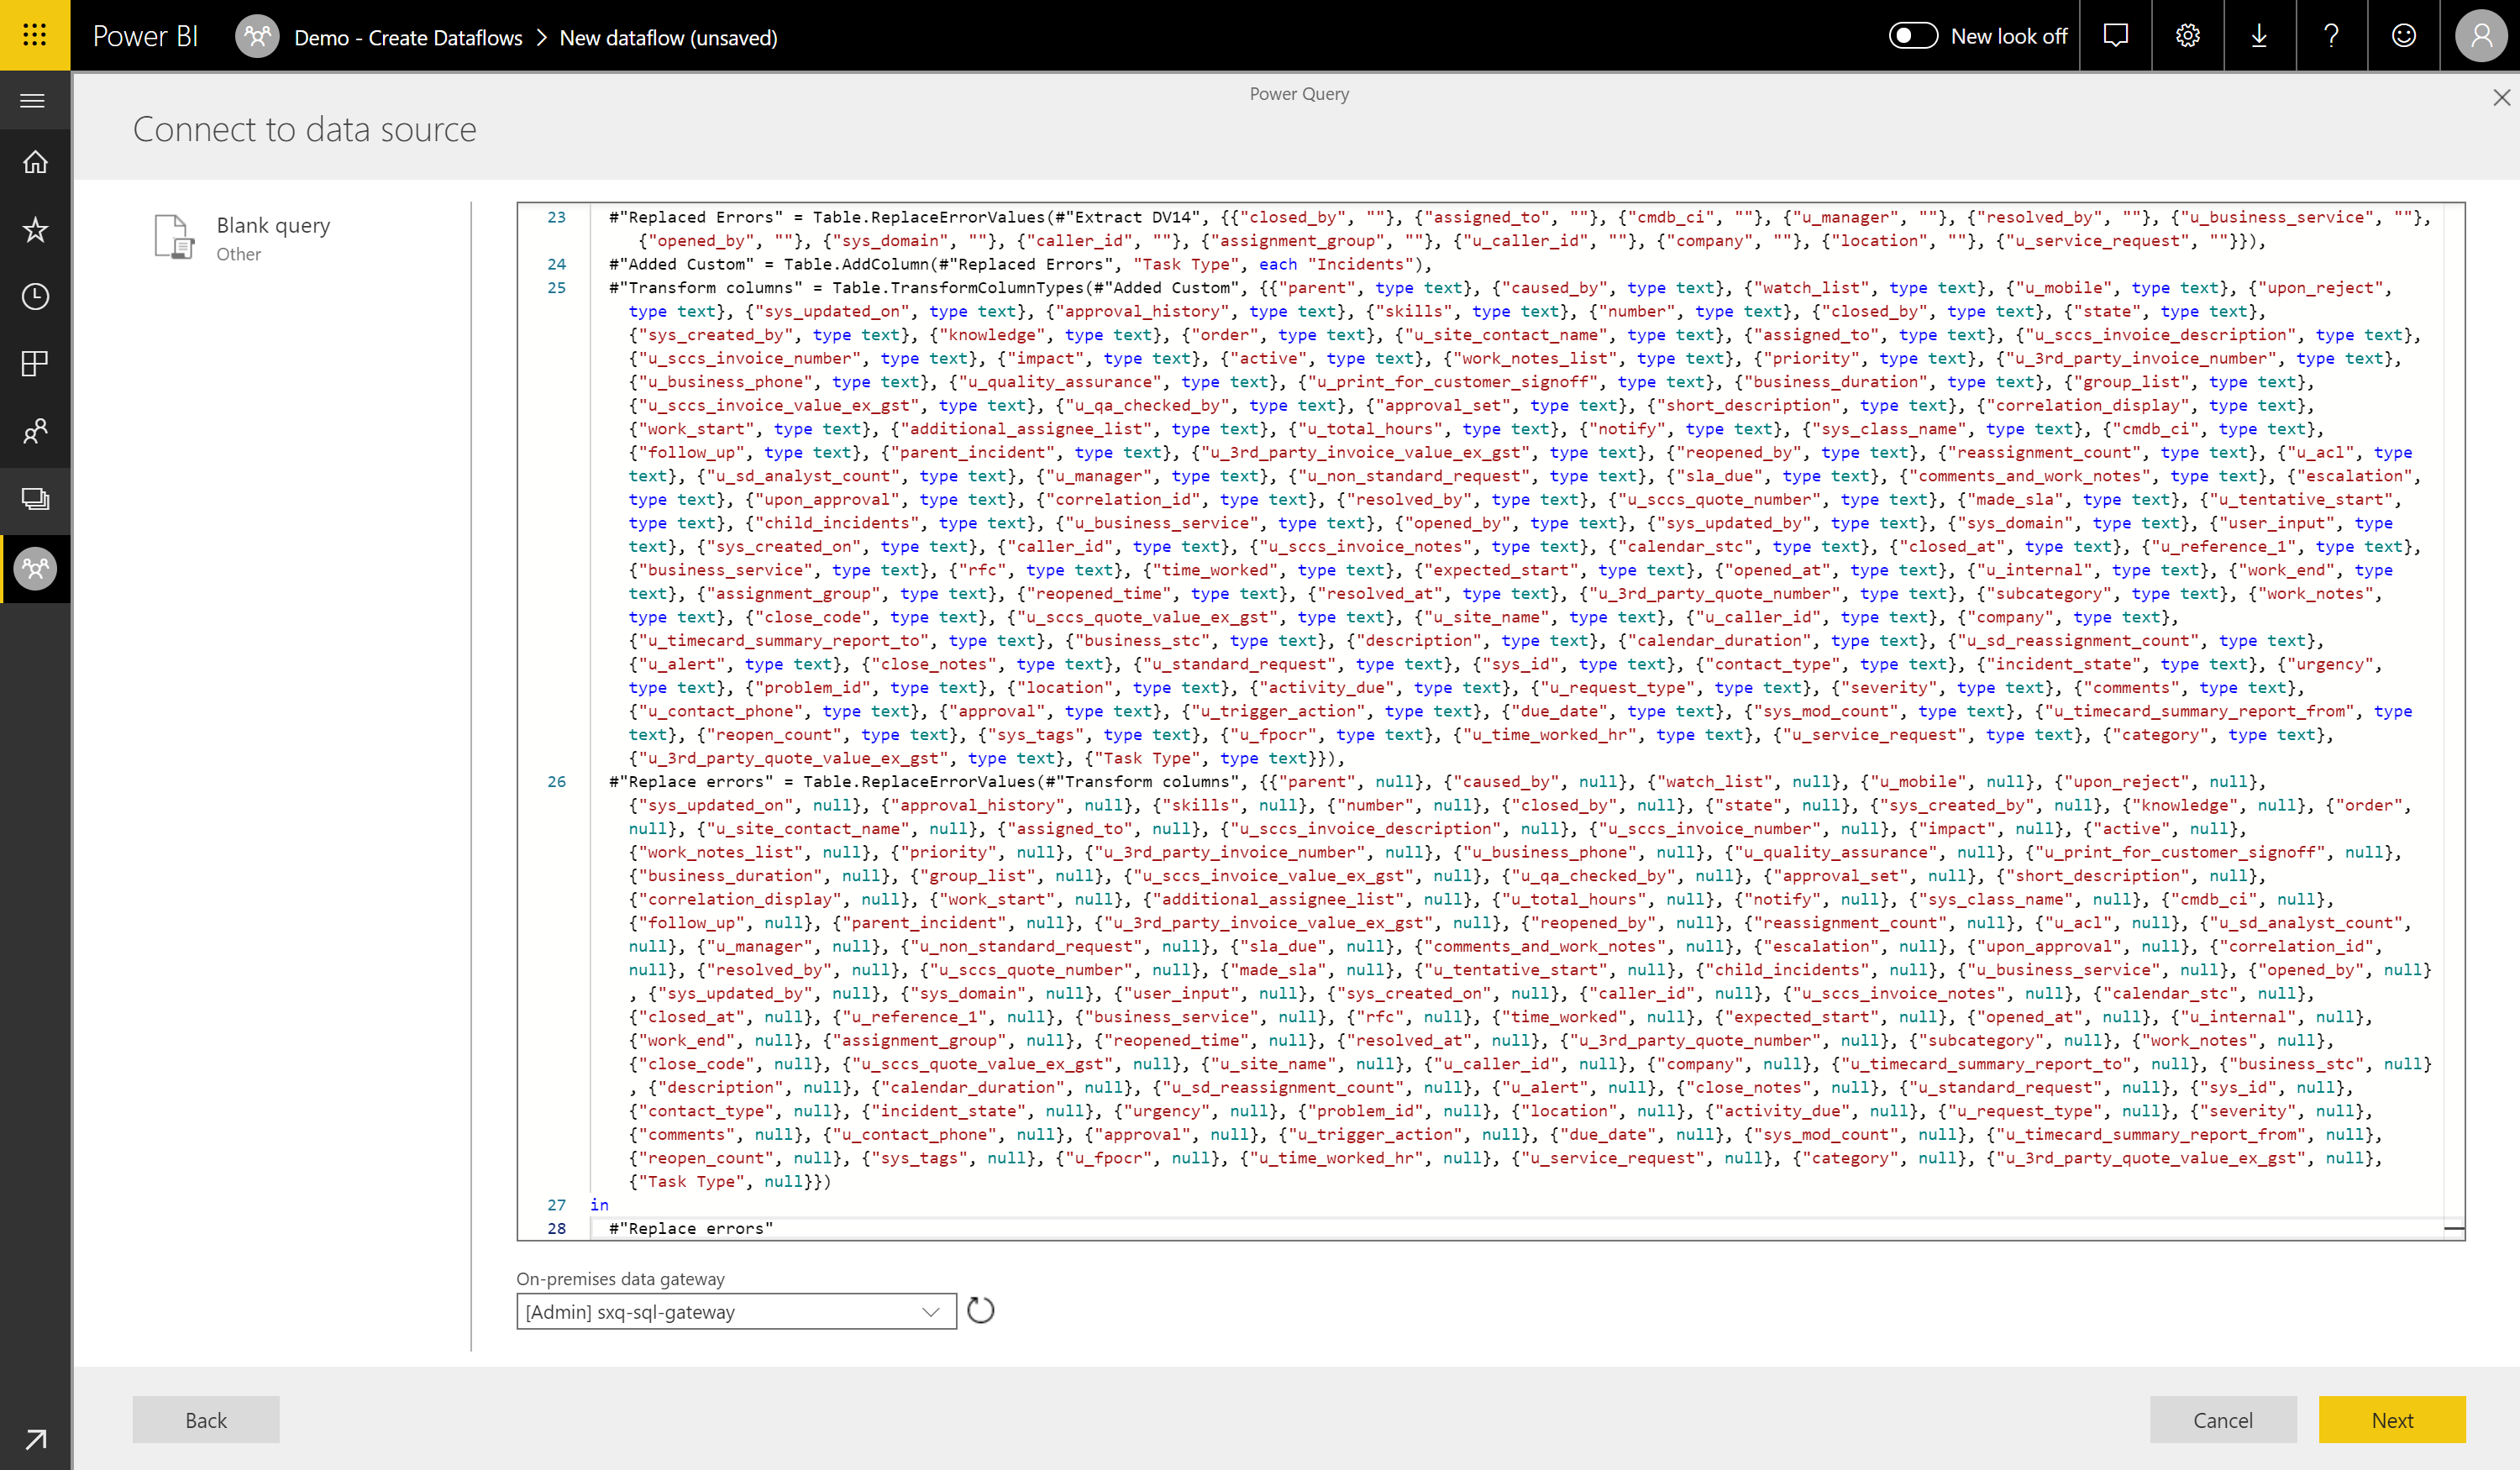
Open up your Power BI Desktop and go to the Advanced Editor as we did in Step 3. Simply copy & paste everything from the desktop advanced editor to the new Blank Query in our Dataflows. Ensure that you have your gateway configured and press Next.
Paste into Advanced Editor
Almost there! We head back to our Power BI Dekstop and select New Source. In the new source pop-up, navigate to Power BI and then Power BI dataflows.
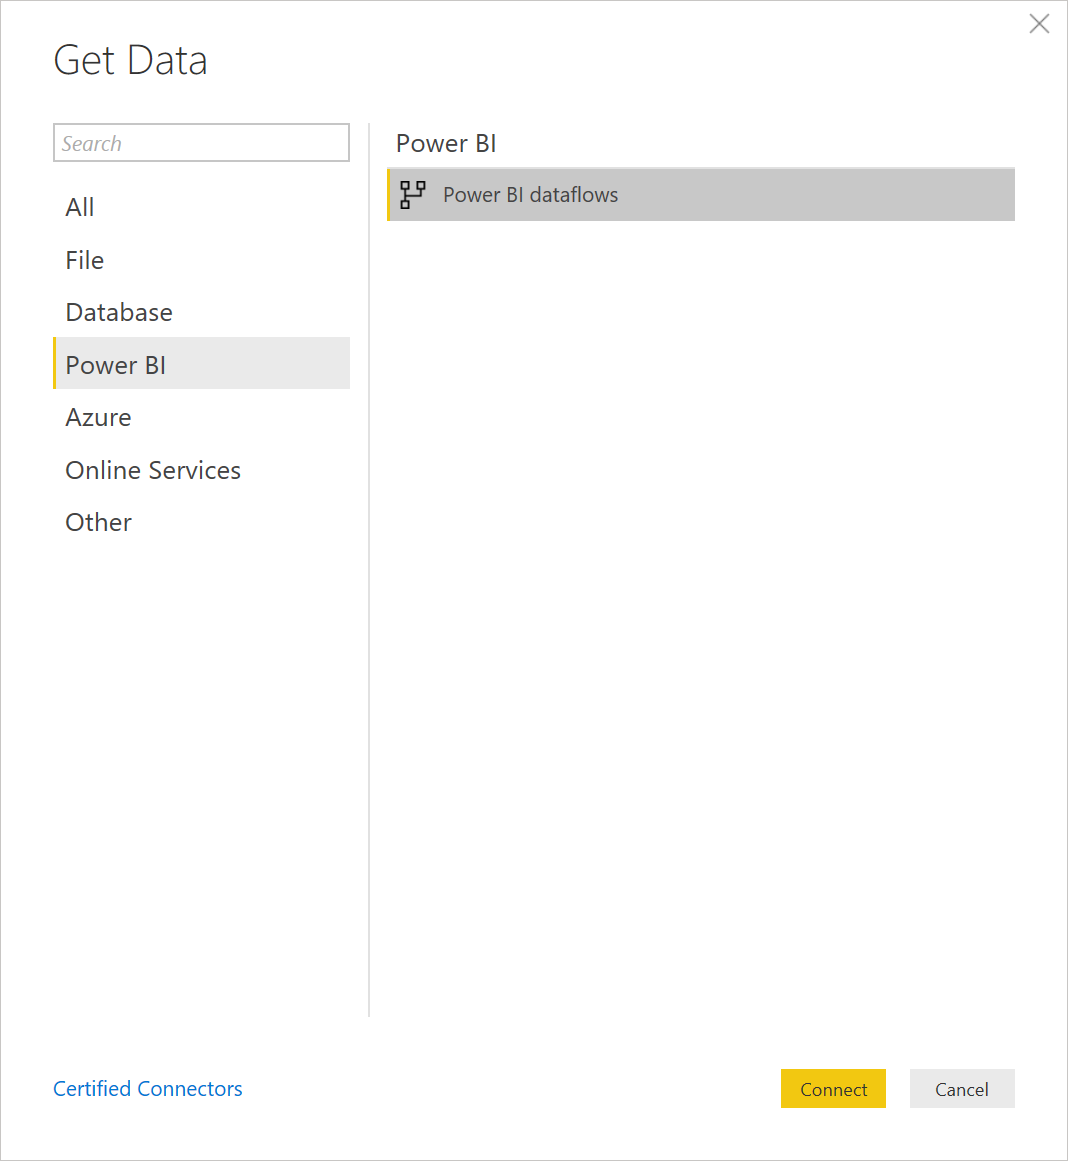
Get Data
Confirm and navigate to your Dataflow to load this dataset into Power BI Desktop.
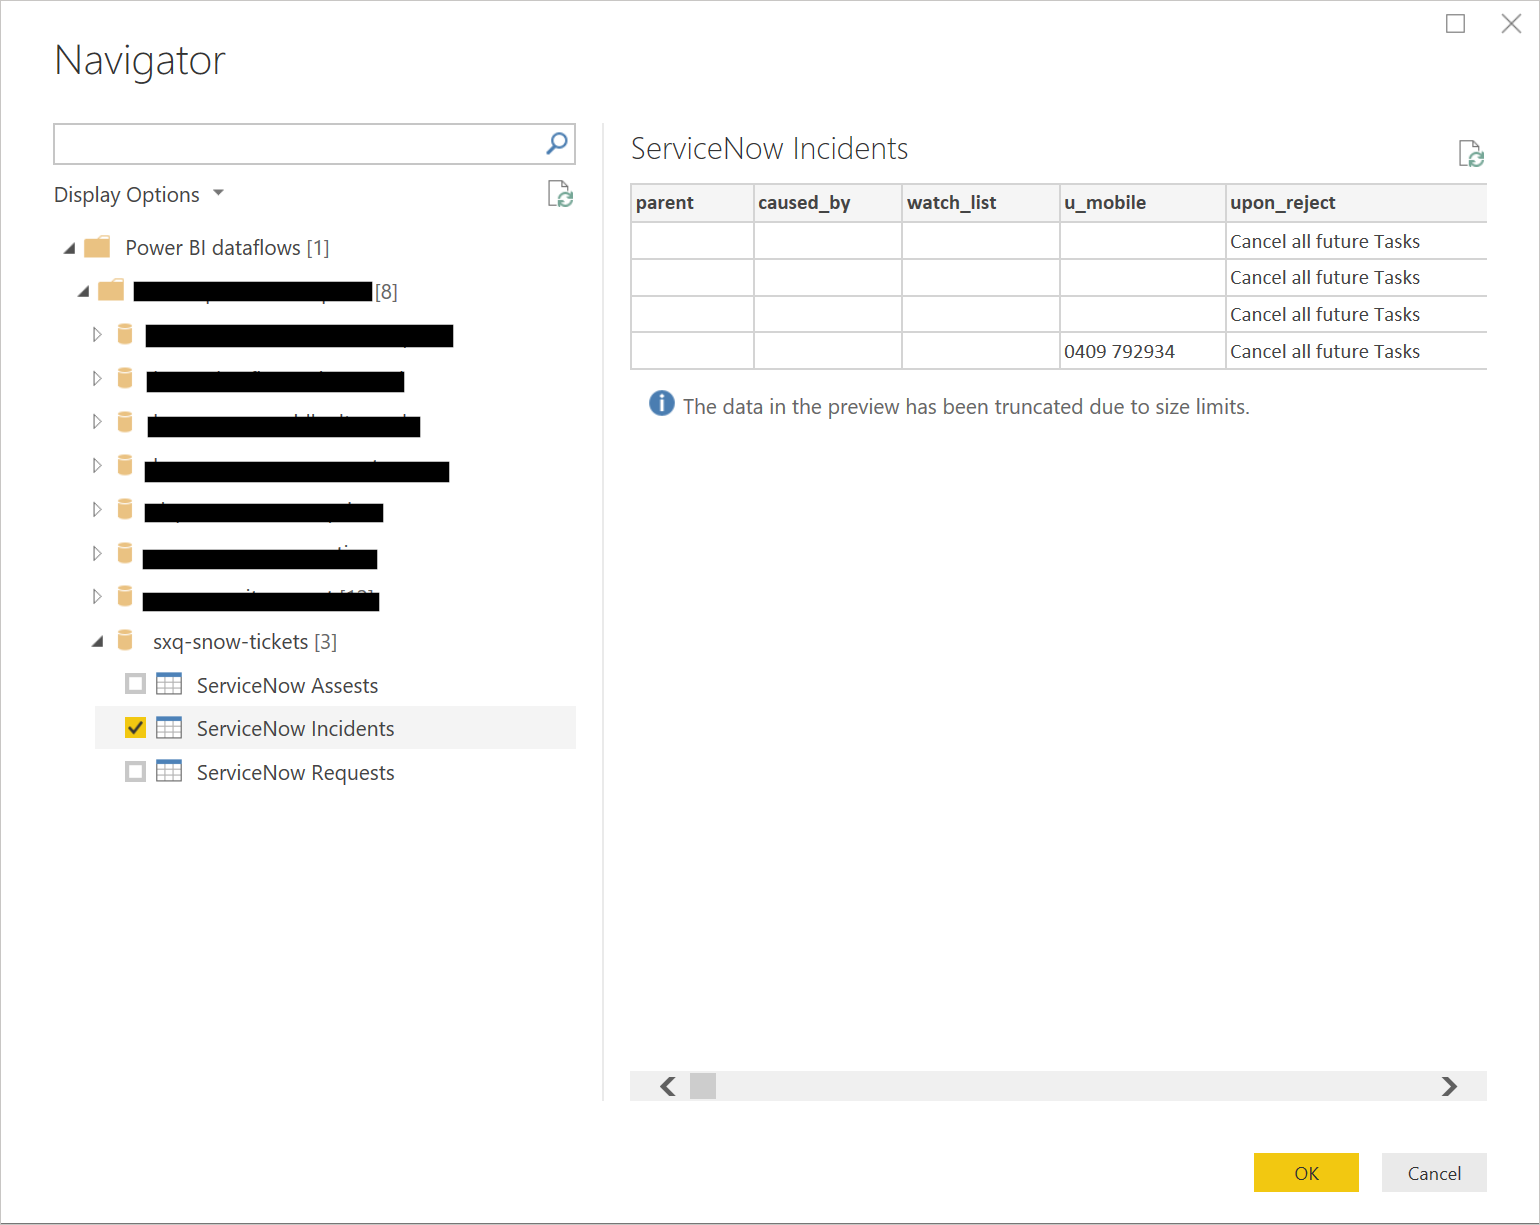
Choose your dataset
Now you're ready to start building your reports in Power BI Desktop - if you've got a massive dataset, you will be able to see a noticeble difference in performance. For any further changes required in your dataset, you can do them within your desktop app, but we would recommend that you do as much of the transformations in Power BI dataflows as much as possible.
Note
If you find that your dataset is returning empty rows, head over to the dataflow page on your portal and refresh the dataflow set.
Once you get the hang of Power BI, you will be able to construct and customise your own reports like the ones below:

Power BI - Report Summary Page
